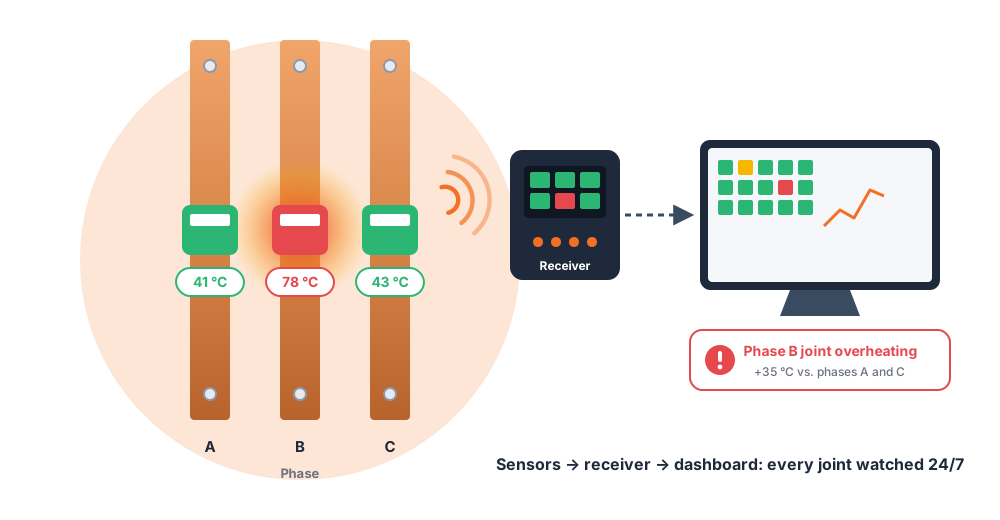
Busbar temperature monitoring is the continuous measurement of temperature at busbar joints and connections in switchgear, panels and bus ducts. Sensors on each critical point report to a controller or software platform that raises an alarm when a connection overheats, so loose or degraded joints are fixed before they cause outages or fires.
Key takeaways
- Busbar hotspots almost always form at joints, terminations and contacts, where rising contact resistance turns current into heat (P = I²R).
- Continuous monitoring catches problems that periodic infrared surveys miss, such as night-time peaks and fast-developing faults.
- Judge readings by context: rise above ambient, comparison between phases and rate of rise, not just a fixed limit.
- Wireless sensors are the most practical choice for retrofitting LV switchgear and bus ducts; fibre-optic sensing suits many MV/HV applications.
- A complete system combines sensors, receivers, SCADA or cloud integration, and software for trends, alarms and reports.
What Is Busbar Temperature Monitoring?
Busbar temperature monitoring is the continuous measurement of temperature at busbar joints, connections and terminations in switchgear, panels and bus ducts. Sensors on each critical point report readings to a controller or software platform, which compares them against thresholds, against the other phases and against ambient, and raises an alarm when a connection starts to overheat.
A busbar joint’s temperature changes with load, ambient conditions and time, so a single reading only shows one moment. Continuous monitoring turns those moments into a trend, so you can tell a joint that is simply carrying more current from one whose contact resistance is rising, often weeks or months before it fails.
In short: busbar temperature monitoring replaces occasional spot checks with 24/7 visibility of every critical connection, so loose, oxidised or overloaded joints are found and fixed during planned maintenance instead of causing an outage or fire.
How Does a Busbar Temperature Monitoring System Work?
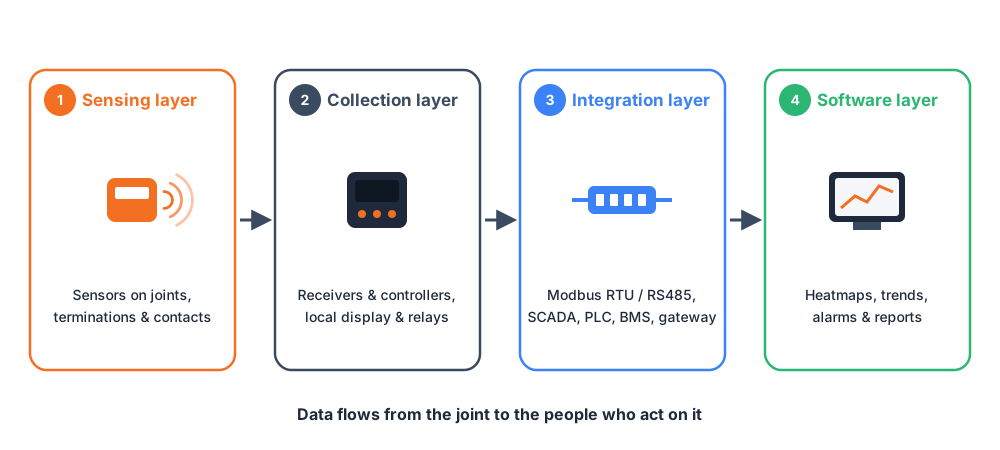
Most systems follow the same four-layer architecture, from the joint to the person who acts on the data:
- Sensing layer: temperature sensors mounted directly on joints, terminations and contacts. They measure every few seconds and transmit wirelessly, through optical fibre or by cable.
- Collection layer: receivers or controllers inside the panel gather readings from dozens of sensors, show them locally and drive alarm relays for hooters or trip circuits.
- Integration layer: data passes to SCADA, PLC or a building management system, typically over Modbus RTU on RS485, or through a gateway to the cloud.
- Software layer: dashboards turn readings into heatmaps, phase comparisons, trends, alarms and reports that maintenance teams can act on.
Smart sensors don’t simply report at a fixed interval. The AMP-WM2THC, for example, measures every 20 seconds and transmits every 60 seconds, but sends an event packet straight away if the temperature rises faster than a set trigger. That way a fast-developing fault is reported within seconds rather than at the next scheduled update.
Why Do Busbars Overheat?
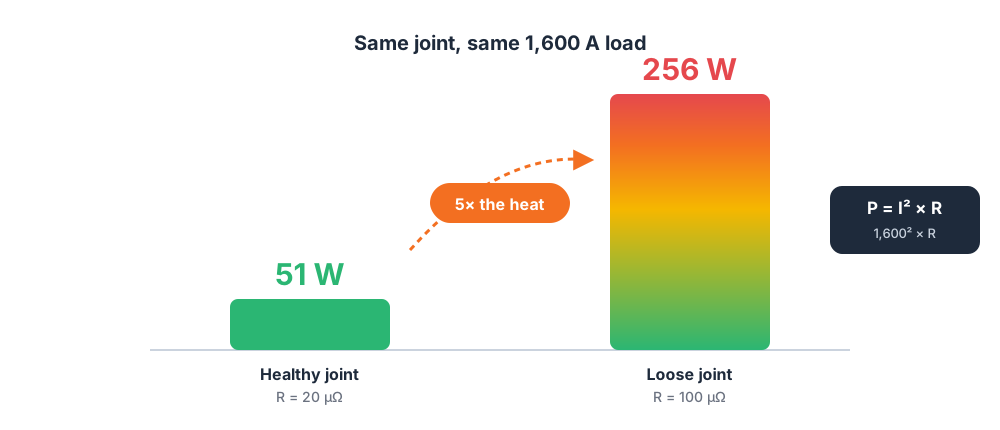
Almost every busbar hotspot comes back to one equation: heat generated at a connection is P = I² × R. Current is set by the load, so the variable that changes is resistance, and small increases in contact resistance produce large increases in heat.
Worked example: a joint carrying 1,600 A with a healthy contact resistance of 20 µΩ dissipates about 51 W. If the bolts loosen and resistance rises to 100 µΩ, the same joint now dissipates about 256 W: five times the heat, concentrated in a few square centimetres.
The main causes of rising resistance and temperature are:
- Loose connections: insufficient torque at installation, vibration and repeated thermal expansion and contraction gradually reduce clamping force.
- Oxidation and contamination: oxide films, dust and moisture on contact surfaces raise resistance, especially on aluminium and in humid or polluted environments.
- Overloading and load growth: currents above the busbar’s design rating heat the whole conductor, not just the joints.
- Unbalanced loads and harmonics: one phase carrying more current, or harmonic currents loading the neutral, makes individual conductors run hotter.
- Poor ventilation: blocked vents, high ambient temperature and failed cooling reduce the heat a panel can shed.
- Installation and design issues: mismatched materials, missing washers, incorrect contact area or undersized conductors.
These causes reinforce each other. Heat accelerates oxidation and loosening, which raises resistance, which creates more heat. This self-feeding cycle, often called thermal runaway, is why a joint can stay stable for years and then fail within weeks. Continuous monitoring is designed to catch it at the start of the curve.
Where Do Busbar Hotspots Form?
Hotspots almost always form at connections rather than along a straight run of busbar. These are the points to prioritise:
| Location | Why it overheats | Monitoring priority |
|---|---|---|
| Bolted busbar joints and splices | Clamping force loss, oxidation, thermal cycling | High |
| Cable terminations and lugs | Poor crimping, loose lugs, undersized cable | High |
| Circuit breaker fixed and moving contacts | Contact wear, misalignment, racking issues | High |
| Bus duct (busway) joints and tap-off units | Vibration, long runs, difficult access | High |
| Bus coupler and incomer connections | Carry the highest currents in the board | High |
| Transformer LV terminals | High current, heat from the transformer itself | Medium–High |
| Capacitor bank and fuse connections | Harmonic currents, frequent switching | Medium |
For a deeper look at each of these, see Why Electrical Connections Overheat: 5 Hotspots to Check.
What Busbar Temperature Is Too Hot?
There is no single “safe” temperature, because limits depend on the conductor material, plating, insulation and the standard your equipment is built to. Two references are widely used.
Design limits: IEC 62271-1
For high-voltage switchgear and controlgear, IEC 62271-1 sets maximum temperatures and temperature rises for bolted connections in air, based on a maximum ambient of 40 °C:
| Bolted connection in air | Maximum temperature | Maximum temperature rise |
|---|---|---|
| Bare copper, copper alloy or aluminium alloy | 90 °C | 50 K |
| Tin-coated | 105 °C | 65 K |
| Silver- or nickel-coated | 115 °C | 75 K |
Low-voltage assemblies are covered by the IEC 61439 series, and your switchgear manufacturer’s documentation takes precedence. Always confirm limits against the standard edition and equipment rating that apply to your installation.
Maintenance guidance: temperature differences
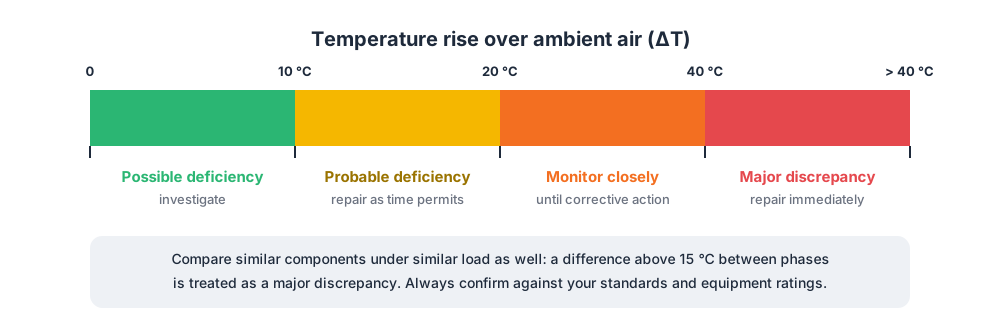
For condition assessment, maintenance teams usually look at differences rather than absolute values. ANSI/NETA maintenance testing guidance for thermographic surveys classifies findings like this:
| Temperature difference | Similar components, similar load | Over ambient air |
|---|---|---|
| Possible deficiency: investigate | 1–3 °C | 1–10 °C |
| Probable deficiency: repair as time permits | 4–15 °C | 11–20 °C |
| Monitor until corrective action is possible | — | 21–40 °C |
| Major discrepancy: repair immediately | > 15 °C | > 40 °C |
How to set alarms in a monitoring system
Continuous monitoring lets you combine several checks, which is far more reliable than a single fixed limit:
- Warning and critical thresholds set from the equipment rating, for example the limits above with a safety margin.
- Rise above ambient (ΔT), which separates real heating from a hot day.
- Phase deviation: one phase running hotter than the other two under similar load is one of the earliest signs of a bad joint.
- Rate of rise: a sudden increase over minutes points to a developing fault even while the temperature is still below the limit.
Online Busbar Temperature Monitoring vs. Infrared Thermography
Infrared (IR) thermography has been the standard inspection method for decades, and NFPA 70B treats it as a routine maintenance task, typically performed at least annually. Online monitoring doesn’t replace it; it fills the gaps between surveys.
| Online temperature monitoring | Periodic IR thermography | |
|---|---|---|
| Coverage in time | Continuous, 24/7 | A snapshot every 6–12 months |
| Catches night-time and peak-load events | Yes | Only if they happen during the survey |
| Needs line of sight | No: sensors sit on the joint | Yes: covers or IR windows required |
| People near energised equipment | Not for routine checks | Yes, for every survey |
| Trend and rate-of-rise data | Yes, with history | No, only individual images |
| Visual overview of the whole panel | Only at monitored points | Yes |
| Best use | Critical joints you can’t afford to miss | Broad periodic surveys and verification |
Most facilities use both: thermography for wide-area surveys, and online monitoring on the critical joints where a missed hotspot would be most expensive. If you’re weighing the switch, read When to Upgrade to Continuous Temperature Monitoring.
Busbar Temperature Sensor Technologies Compared
Several sensing technologies are used on busbars. Each fits different voltages, budgets and installation constraints:
| Technology | How it works | Strengths | Watch-outs | Best for |
|---|---|---|---|---|
| Wireless, battery-powered | Digital sensor with radio and internal battery | Fast retrofit, no wiring, low cost per point, rich data | Battery life must be planned (typically 5–10 years) | LV switchgear, panels, bus ducts |
| Wireless, self-powered (CT) | Harvests energy from the busbar’s magnetic field | No battery, long service life, LV to HV | Needs a minimum load current to operate | Continuously loaded LV/MV/HV conductors |
| Passive SAW / RFID | Battery-free tag read by an RF interrogator | No battery, small size | Reader antennas needed in each compartment; limited data | MV switchgear compartments |
| Fluorescent fibre-optic | Fluorescent decay time in a probe, read over optical fibre | Immune to EMI, fully dielectric, high accuracy | Fibre routing makes retrofit harder; higher cost | MV/HV switchgear, transformers |
| Distributed temperature sensing (DTS) | Laser scattering along a sensing fibre | Continuous profile along long runs | Interrogator cost; less suited to discrete joints | Long cable and busway runs |
| Fixed infrared sensors | Non-contact IR measurement of a spot | No contact with live parts | Needs clear line of sight; affected by emissivity | Selected targets with good visibility |
For most low-voltage switchboards and bus ducts, wireless sensors give the best balance of coverage, cost and ease of retrofit, which is why they’re the most widely deployed option. For a deeper comparison of wireless protocols and battery life, see our guide to battery and RF wireless temperature monitoring.
Components of a Busbar Temperature Monitoring System
Here’s how the layers map to real hardware, using the Amptronics Wireless Busbar Temperature Monitoring System (WBTMS) as an example:
| Component | Role | Example |
|---|---|---|
| Busbar temperature sensor | Measures joint temperature and transmits it wirelessly | BBS350BT: battery-powered, -40 to 125 °C, up to 5-year battery |
| Self-powered sensor | Battery-free sensing on loaded conductors up to 66 kV | BBS350CT: CT-powered from 4 A, -40 to 150 °C |
| Bus duct sensor | Surface temperature plus ambient humidity on bus duct joints | AMP-WM2THC: magnetic mount, IP65, up to 10-year battery |
| Ambient sensor | Panel temperature and humidity to catch condensation | AMP-WRHTC: 0–95% RH, 5-year battery |
| Display controller | Local display, buzzer and alarm relays at the panel | BBC969-27C: colour display, up to 60 sensors |
| Modbus receiver | Collects sensor data for PLC/SCADA/BMS | BBC969-485RC: Modbus RTU over RS485, 2 relays |
| Gateway | Sends data to the cloud for remote access | AMP-IoTG: 4G gateway |
| Software and dashboard | Heatmaps, trends, alarms, predictive findings and reports | WBTMS dashboard |
Benefits of Busbar Temperature Monitoring
- Fewer unplanned outages: deteriorating joints are found early and repaired during planned shutdowns, not after they fail.
- Lower fire and arc-flash risk: overheating connections are a common starting point for insulation failure and electrical fires.
- Safer maintenance: routine checks no longer require opening energised panels or standing in front of live equipment.
- Condition-based maintenance: crews tighten and clean the joints that need it, rather than every joint on a fixed calendar.
- Longer asset life: keeping connections within their thermal limits slows insulation ageing and contact degradation.
- Lower losses: high-resistance joints waste energy as heat; fixing them reduces I²R losses.
- Evidence for audits and insurers: trend data and alarm history document asset condition and maintenance actions.
Where Is Busbar Temperature Monitoring Used?
| Application | What is monitored | Why it matters |
|---|---|---|
| Data centres | Main switchboards, PDUs, busway tap-offs | Uptime is critical and loads are high and continuous |
| Power utilities and substations | MV switchgear, incomers, transformer terminals | Grid reliability and remote, unmanned sites |
| Industrial plants | PCC/MCC panels, bus ducts, motor feeders | Heavy, cyclic loads and costly production stops |
| Renewable energy | Inverter and collector switchgear | Remote sites with variable loading |
| Commercial buildings and hospitals | LT panels, rising mains and bus ducts | Life safety and difficult maintenance access |
| Oil & gas and process industries | Switchgear in harsh, high-temperature areas | Fire risk and safety-critical processes |
How to Choose a Busbar Temperature Monitoring System
Use this checklist when comparing systems:
- Voltage level and clearances: confirm the sensor is rated for your system voltage and won’t compromise insulation distances.
- Sensor power: battery life at your reporting interval, or self-powered operation, and the minimum load current it needs.
- Measuring range and accuracy: look for a range well above your alarm limits and around ±0.5–1 °C accuracy at normal operating temperatures.
- Mounting and retrofit: strap-on, clamp-on or magnetic mounting without drilling, sized for your busbars and cables.
- Capacity and range: how many sensors each receiver supports, and the radio range inside metal enclosures.
- Integration: Modbus RTU/RS485 for SCADA, PLC and BMS, relay outputs for local alarms, and cloud or gateway options.
- Alarm intelligence: support for ambient, phase-deviation and rate-of-rise alarms, not just a fixed limit.
- Security: encrypted wireless links (for example AES-128) and controlled configuration access.
- Software: dashboards, trends, reports and an auditable alarm history.
- Support: local engineering help for surveys, commissioning and after-sales service.
Our article on how to choose a wireless temperature monitoring system goes into each criterion in more detail.
How to Implement Busbar Temperature Monitoring: 7 Steps
- Survey and rank your assets: List every switchboard, bus duct run and panel, then rank them by criticality: what it feeds, the cost of an outage, its age and its fault history. Start with incomers, bus couplers and feeders to critical loads.
- Choose the measurement points: For each panel, select the joints most likely to overheat or hardest to inspect: busbar joints, cable terminations and breaker contacts. Monitor all three phases at each location (plus neutral where it carries significant current) so you can compare them.
- Select sensors and receivers: Match the sensor to the location: battery-powered strap-on sensors such as the BBS350BT for most LV joints, self-powered CT sensors such as the BBS350CT where batteries are undesirable, and magnetic sensors such as the AMP-WM2THC for bus ducts. Then size receivers by sensor count and range.
- Install during a planned outage: Wireless sensors strap or clip on without drilling or modifying the busbar, so a short, planned shutdown is usually enough. Note each sensor’s UID against its panel, phase and joint.
- Commission and register sensors: Register each sensor’s UID on the receiver, confirm every sensor has joined, and check that signal strength (RSSI) is good. Reposition the receiver antenna if any sensor shows a weak signal.
- Set thresholds and capture a baseline: Configure warning and critical limits from the equipment rating, then record a baseline over a few weeks of normal load. Add phase-deviation and rate-of-rise alerts so problems show up before an absolute limit is reached.
- Integrate, review and act: Connect the receivers to SCADA, PLC or BMS over Modbus RTU, or send data to a cloud dashboard through a gateway. Review trends regularly and confirm every alarm by inspection under your safe-work procedure.
Tip: treat alarms as prompts to investigate, not diagnoses. Monitoring systems are condition-monitoring tools. They don’t replace protection relays, and every finding should be confirmed by inspection under the site’s safe-work procedures.
Frequently Asked Questions About Busbar Temperature Monitoring
What is the purpose of busbar temperature monitoring?
Its purpose is to detect abnormal heating at busbar joints and connections early, before it damages insulation or causes a fault. Continuous temperature data lets maintenance teams find loose or degraded connections, plan repairs during scheduled outages and avoid unplanned downtime and fire risk.
What is a normal busbar temperature?
There is no single normal value: it depends on load, ambient temperature, conductor size and plating. For high-voltage switchgear, IEC 62271-1 limits bare copper or aluminium bolted connections in air to 90 °C (a 50 K rise over a 40 °C ambient). In practice, compare each joint with its own baseline, with the other phases and with ambient.
How is busbar temperature measured?
It is measured with sensors mounted directly on joints and connections: wireless battery-powered or self-powered sensors, passive SAW/RFID sensors or fibre-optic probes. It can also be checked periodically with handheld infrared cameras through viewing windows. Continuous monitoring uses fixed sensors; thermography gives a snapshot.
Can busbar temperature be monitored while the switchgear is energised?
Yes. Once sensors are installed, they measure and report temperature continuously while the equipment is live, so nobody needs to open energised panels. Installing contact sensors normally requires a planned outage and must follow the site’s safe-work procedures.
Is wireless busbar temperature monitoring safe for medium and high voltage?
Wireless sensors designed for the purpose are compact and insulated, with no wired connection to earth, so they don’t bridge clearances. The BBS350CT, for example, is rated for installations from 0.4 kV up to 66 kV. Always check the sensor’s voltage rating and the switchgear manufacturer’s guidance.
How long do wireless busbar temperature sensor batteries last?
It depends on the design and reporting interval. Amptronics battery sensors are rated for up to 5 years (BBS350BT, AMP-WRHTC) and up to 10 years (AMP-WM2THC). Self-powered CT sensors such as the BBS350CT have no battery and draw power from the busbar current.
What is the difference between busbar temperature monitoring and infrared thermography?
Infrared thermography is a periodic snapshot that needs line of sight and a trained person on site. Busbar temperature monitoring uses fixed sensors to record temperature continuously, catching problems that appear at night, under peak load or between inspections. The two work best together.
How many sensors does a busbar temperature monitoring system need?
It depends on the number of critical joints. A typical approach is one sensor per phase at each monitored location, such as incoming joints, bus coupler joints and outgoing feeder terminations. A single Amptronics receiver supports up to 60 busbar sensors.
Can busbar temperature monitoring be retrofitted to existing switchgear?
Yes. Wireless strap-on, clamp-on and magnetic sensors fit existing busbars, cables and bus ducts without drilling or modifying conductors, and receivers mount in the existing panel on DIN rail or in a panel cut-out. That makes wireless systems the most common choice for retrofits.
Ready to Monitor Every Busbar Joint?
Amptronics designs and builds wireless busbar temperature monitoring systems in Hyderabad, from sensors and receivers to dashboards. Tell us about your switchgear and we’ll recommend the right sensors, monitoring points and integration.
Talk to a Busbar Monitoring Expert